Our regional greenhouse gas emissions have been measured and reported using the production-based Global Protocol methodology for Community-Scale Greenhouse Gas Emissions Inventory. Our dataset goes back to 2000/01
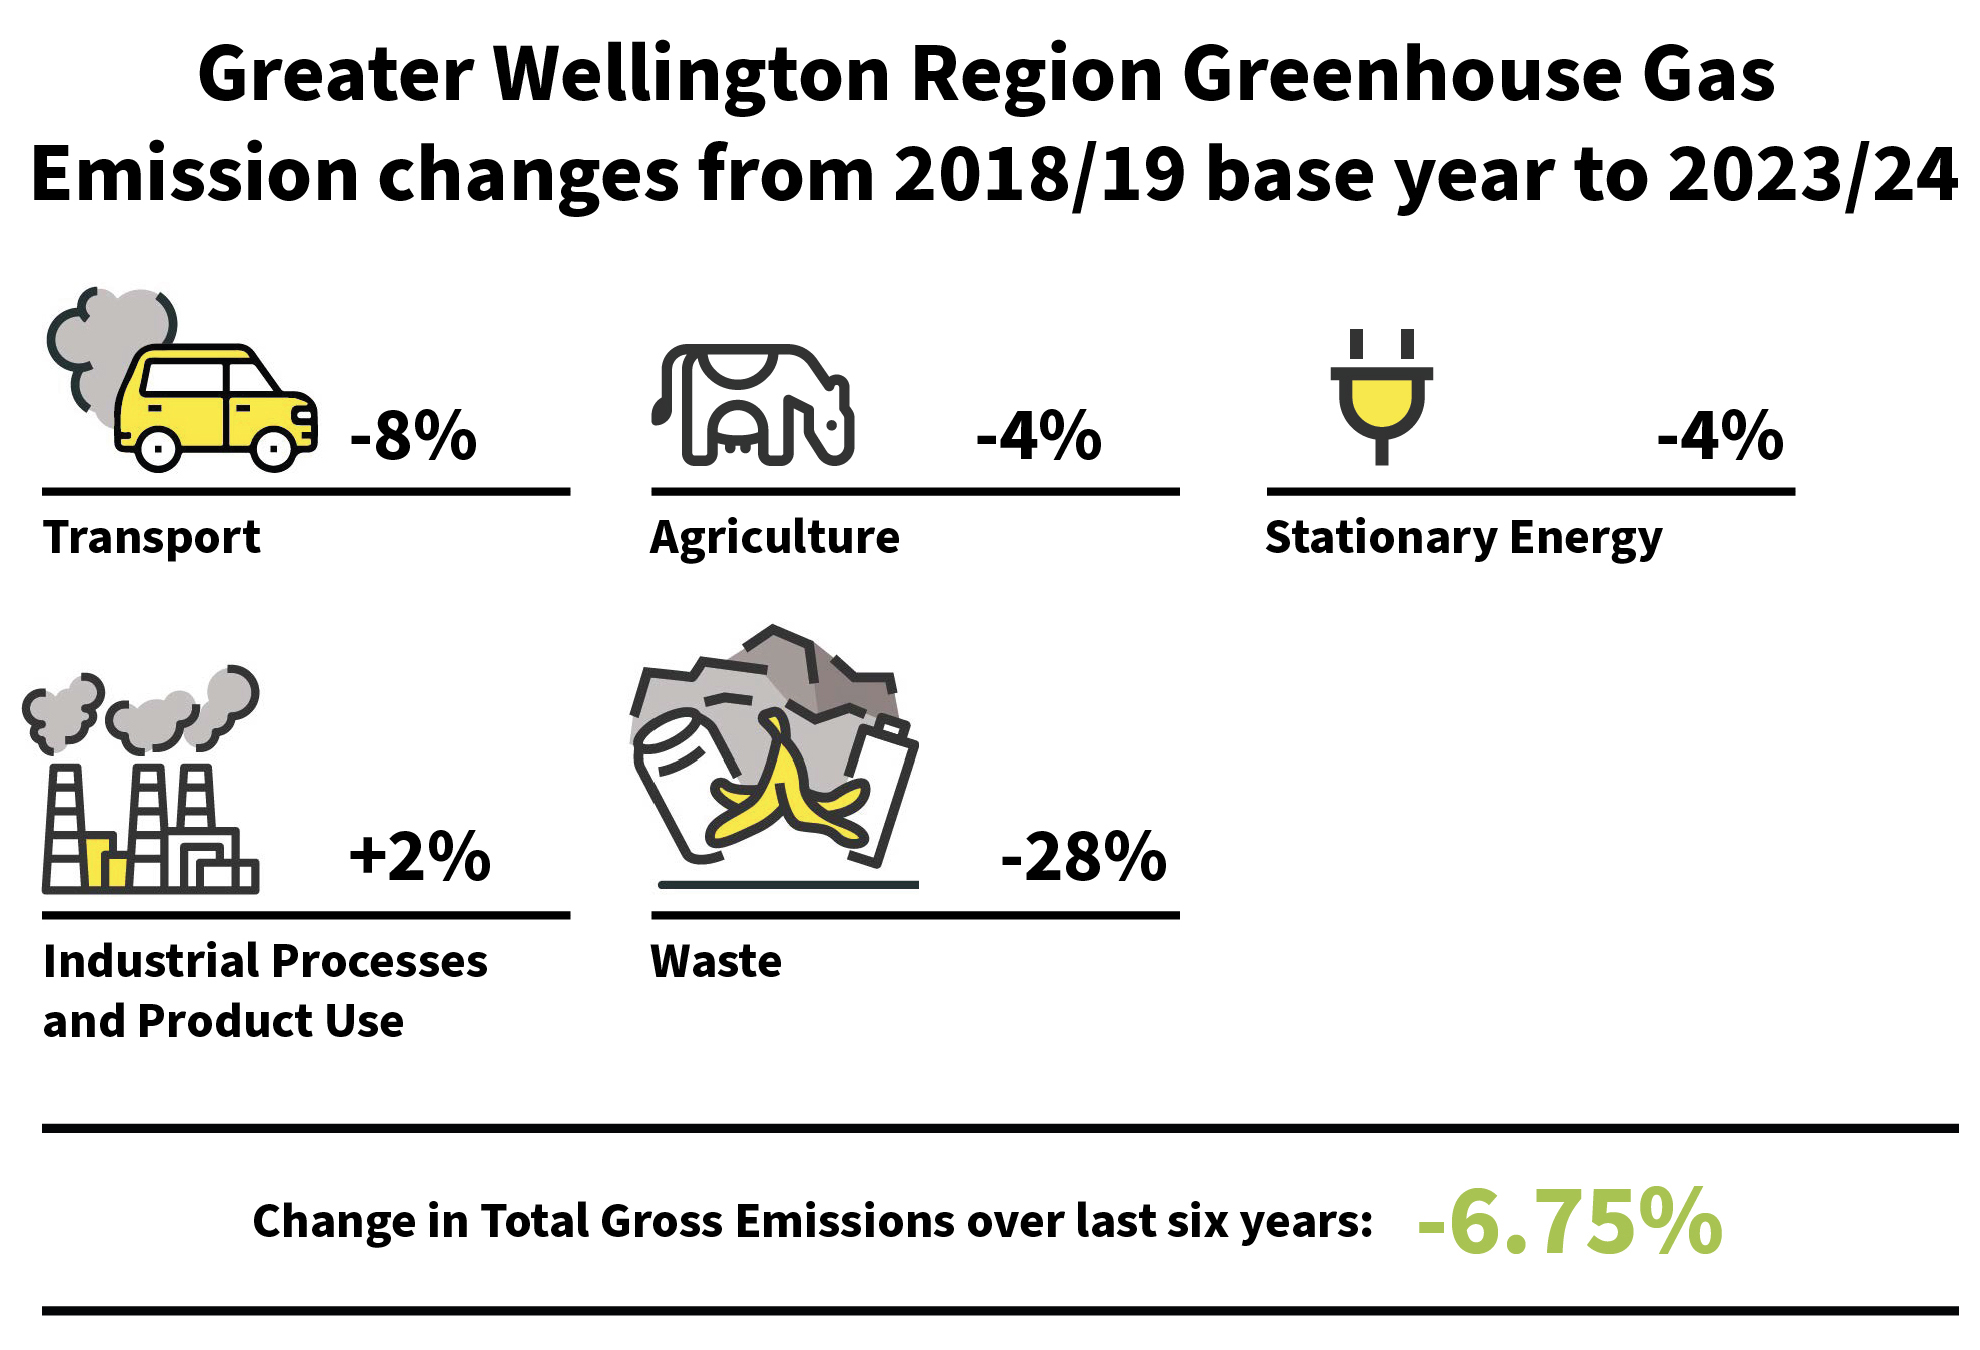
Over the last five years the region’s total gross emissions have decreased by approximately 7%. Since 2001, there has been a 16.6% decrease in emissions despite regional population growth of around 25%.
Whilst these results are going in the right direction, there is much more to achieve in the bigger picture of reducing our region’s input to climate change.
We are committed to leading action for climate change resilience and emissions reduction.
Greater Wellington Region GHG Emissions Inventory 2024
date_range Published 19 Feb 2025
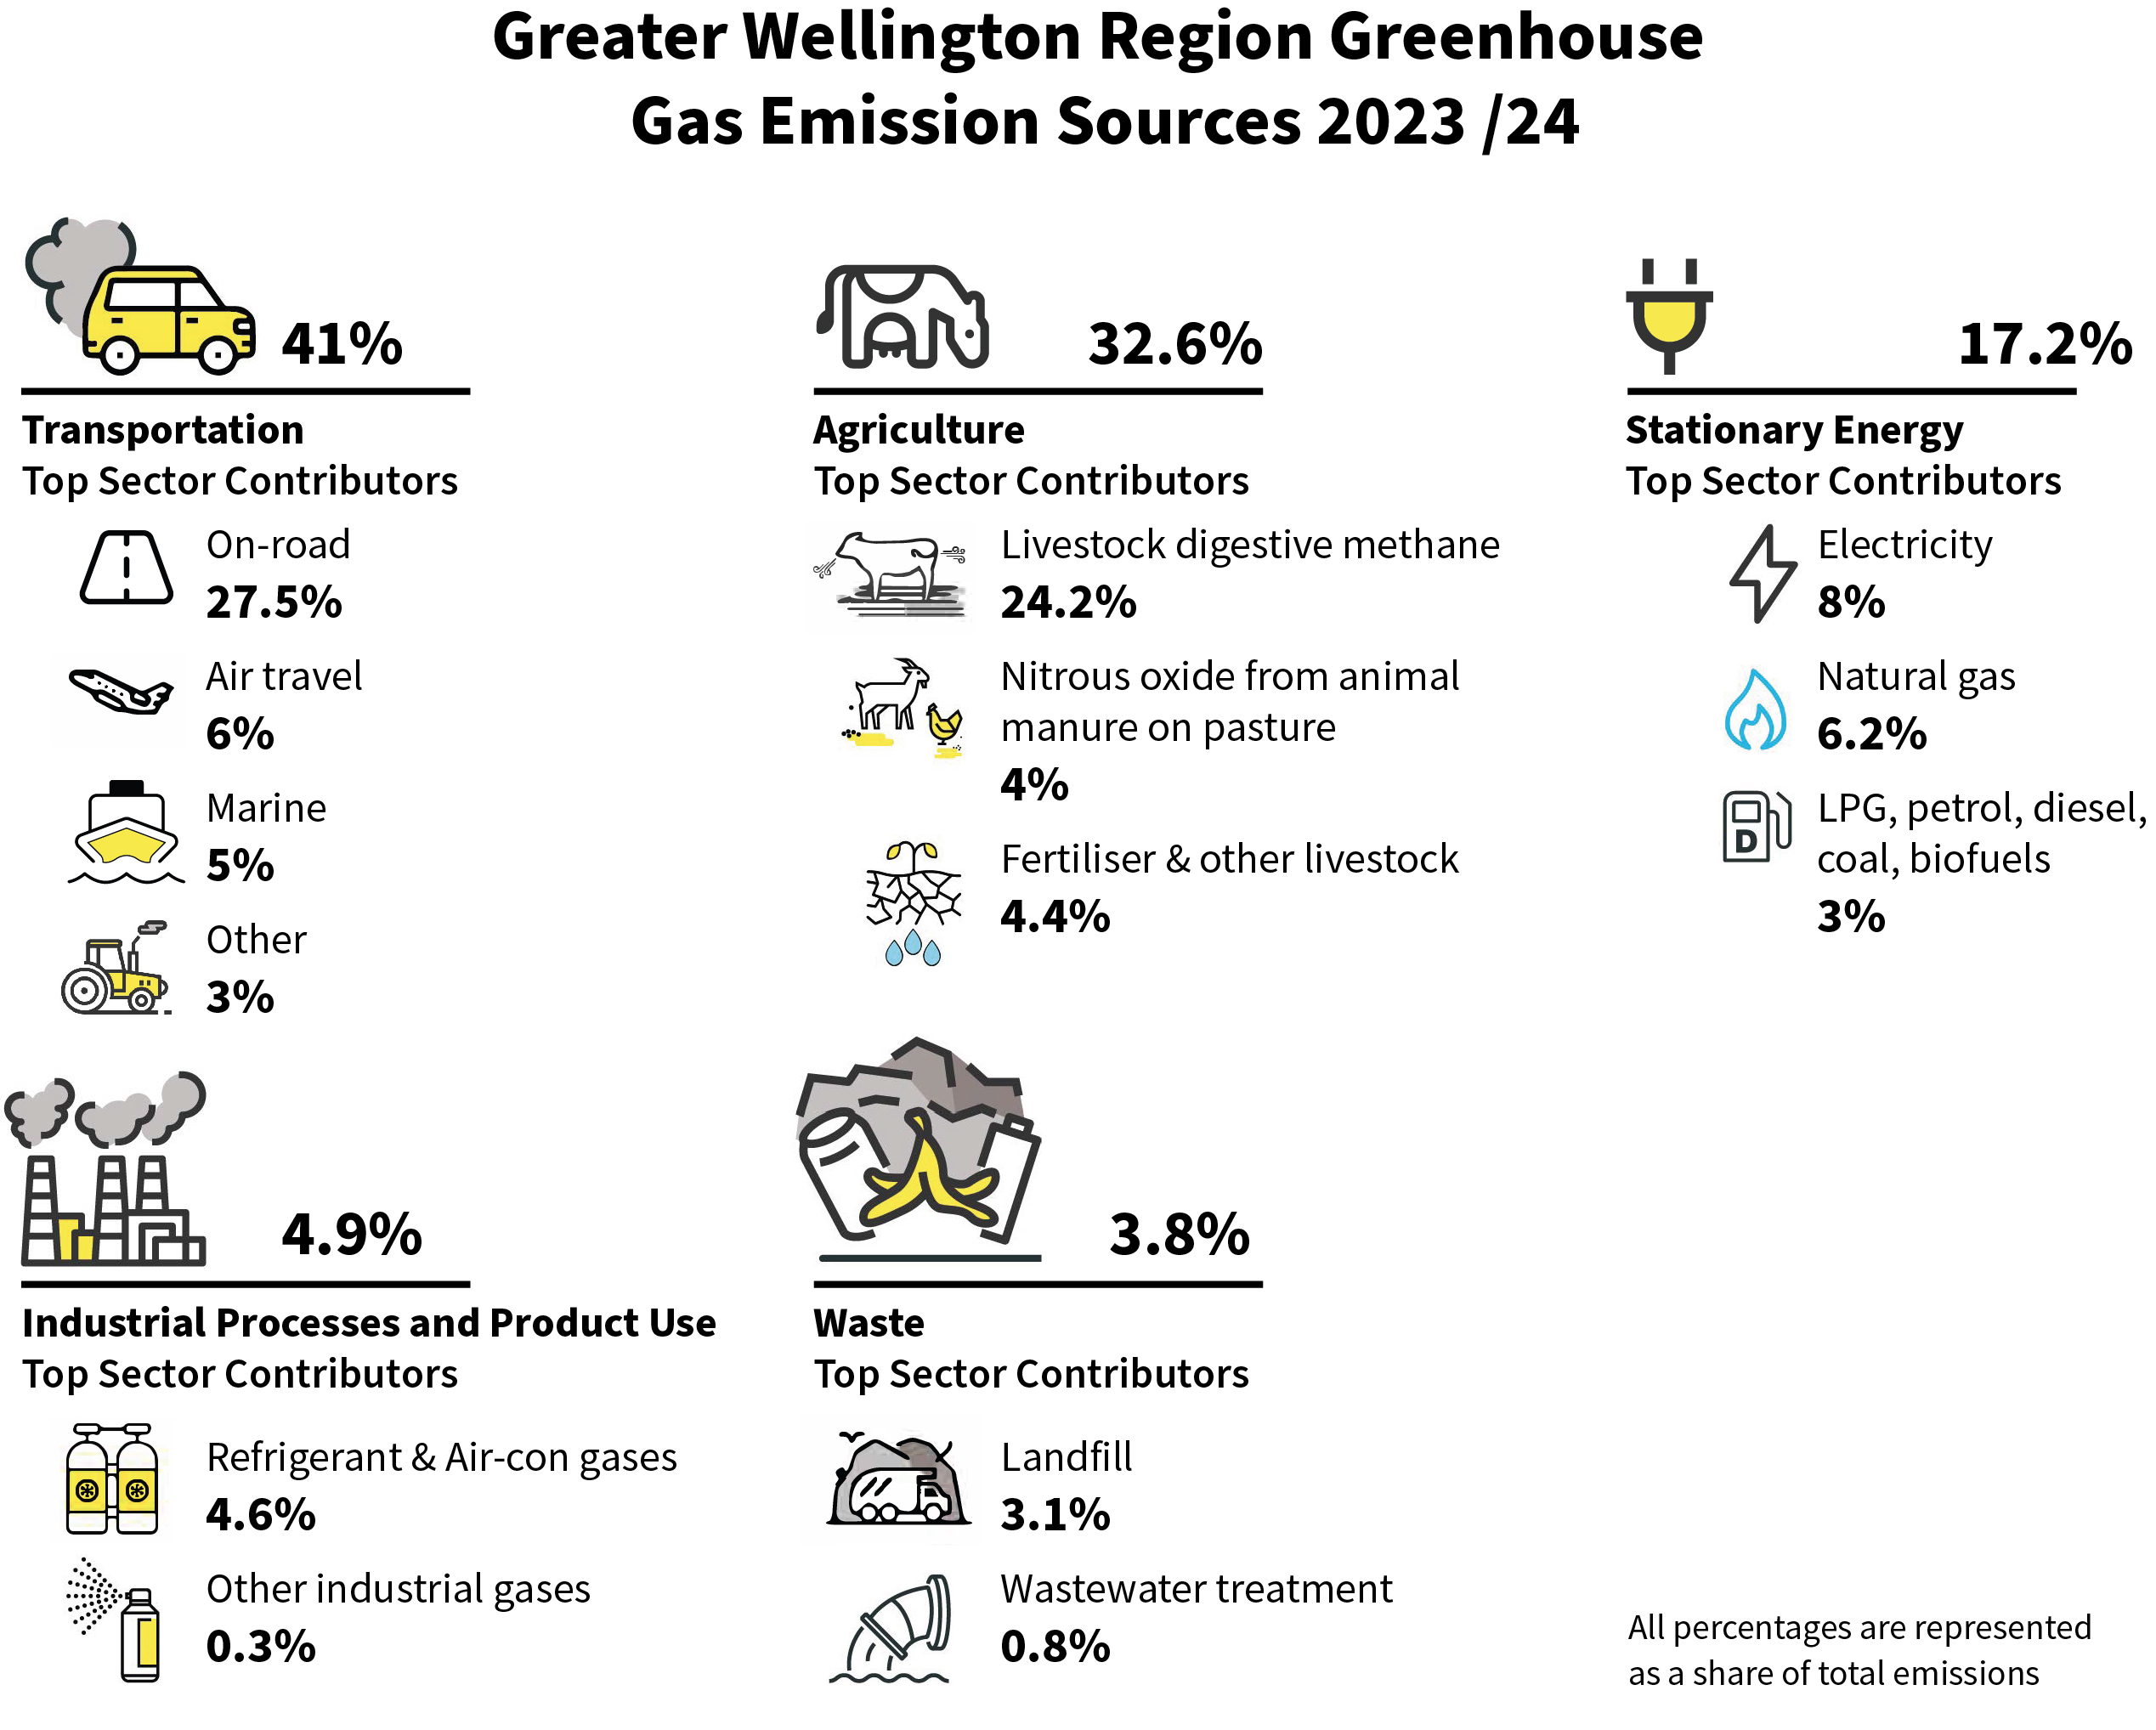
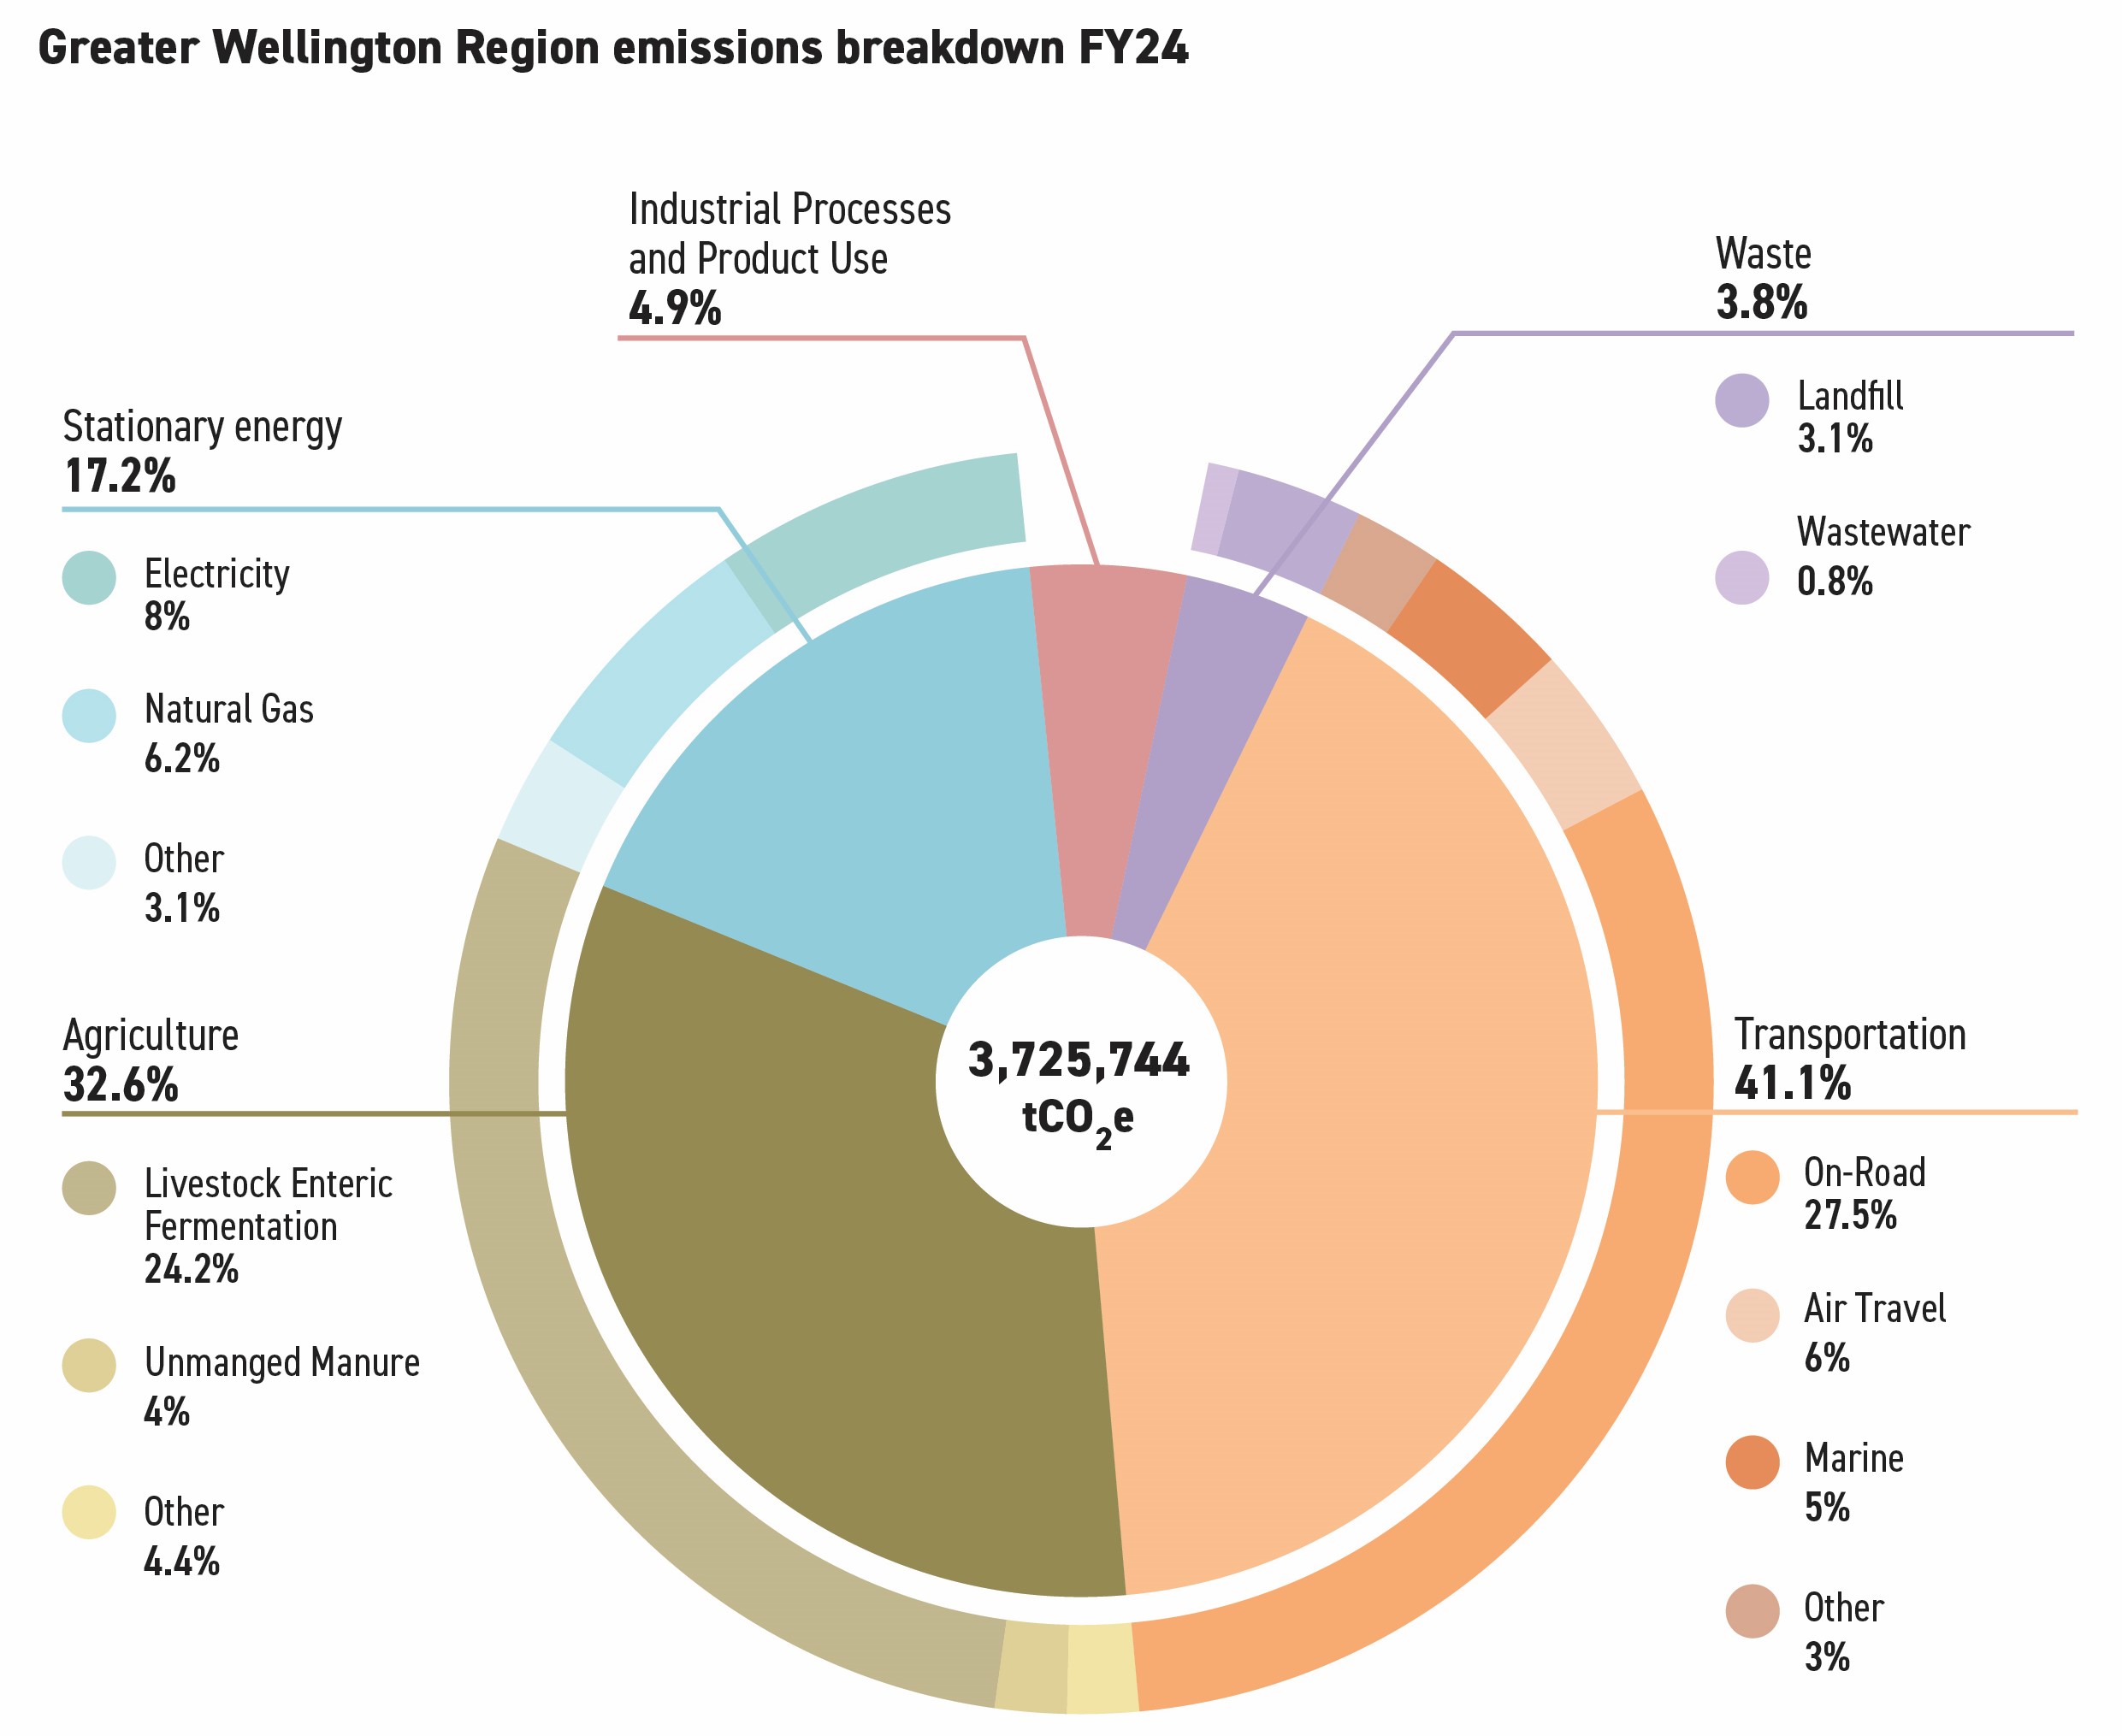
Download now (PDF 1.3 MB) get_appThe update relates to all emissions from activities occurring within the region’s boundaries, as well as emissions from all waste generated in the region (regardless of where it is disposed of) and electricity used in the region (regardless of where it is generated). Half of the emissions from air and sea travel beginning or ending at the region’s ports was also included.
WRLC Regional Emissions Reduction Plan 2024-2030
Past reports
date_range
Published 08 Jun 2023
Greater Wellington Region On-road Transport Emissions


Report positive about drop in emissions, highlights key sectors for continued action
Research shows fall in greenhouse gases over two decades but a worrying rise in transport emissions
Wellington regional greenhouse gas inventory report 2001-2019
Carbon emissions for the Wellington Region have been measured using the Global Protocol for Community Scale Greenhouse Gas Emissions Inventory (GPC). Read more here
date_range Published 01 May 2020
Download now (PDF 2.4 MB) get_appGet in touch
- Phone:
- 0800496734
- Email:
- info@gw.govt.nz